 3 months ago

The post Bitcoin (BTC) Price Recovers Above $66,000—Is the Crypto Market at a Breaking Point? appeared first on Coinpedia Fintech News
Since the October 10, 2025, liquidation event, the crypto market feels noticeably different. Bitcoin’s recent drops are no longer followed by strong relief rallies, which suggests buyers are hesitant to step in aggressively. Adding to the tension, Polymarket is now pricing in a 72% chance of Bitcoin price falling below $55,000 — a clear sign that downside fears are growing.
Recent Bitcoin buyers are already sitting on roughly $26 billion in unrealized losses. If BTC slides toward $60,000 or even lower, those losses could swell to nearly $32 billion.
That kind of pressure can easily trigger panic, forcing weaker hands out before a rebound takes shape. The big question is whether this pain is the final shakeout or a warning of deeper trouble ahead.
Short-Term Bitcoin Holders Are Feeling the Heat
This Glassnode chart shows how short-term Bitcoin holders (recent buyers) are performing in terms of realized profit or loss, adjusted for market activity. The green spikes signal moments when these traders are locking in profits—typically during strong rallies. Red zones, on the other hand, highlight periods where recent buyers are selling at a loss, often during pullbacks or sharp corrections.
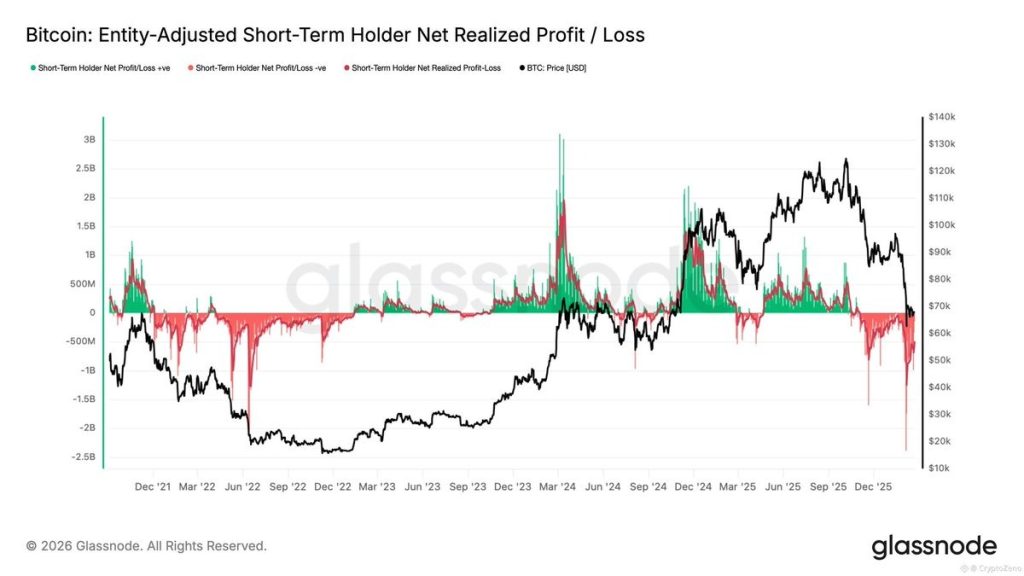
What stands out is the current deep red phase. It suggests many short-term holders are under pressure and sitting on losses as the price retraces. Historically, such conditions reflect fear and weak hands exiting the market. While painful in the short run, these phases often coincide with local bottoms or late-stage corrections, where selling pressure starts to exhaust, and the market quietly prepares for a potential stabilisation or rebound.
Bitcoin Struggles Below Key Resistance as Bears Defend the Trend
This 4-hour BTC chart shows Bitcoin trading below a well-defined descending trend line, which has repeatedly capped upside attempts. Price is currently hovering around the 0.382 Fibonacci zone at $67,300, highlighting short-term indecision. Notably, RSI has rebounded from the lower threshold, signaling short-term selling exhaustion and hinting at a relief bounce. However, since this is a short-term setup, its impact on the broader, long-term trend remains limited.
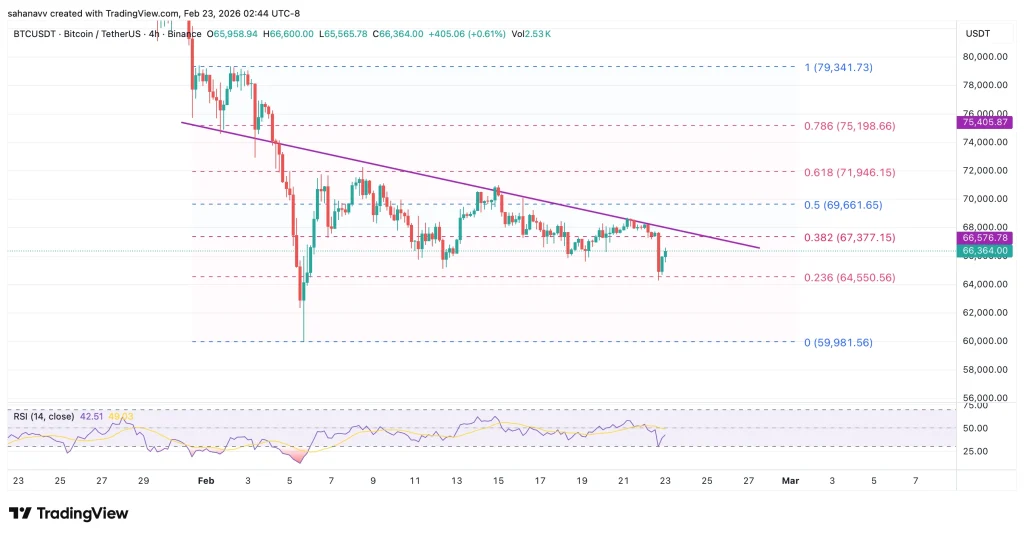
On the bullish side, a reversal would only be validated if Bitcoin decisively breaks and closes above the descending trend line. A sustained move above the 0.5 Fibonacci level (~$69,600) could attract fresh buying pressure, potentially pushing the price toward $72,000, with an extended upside toward $75,000 if momentum follows. On the bearish side, rejection below the trend line keeps the structure weak. A drop below $64,500 (0.236 Fib) may expose BTC to deeper downside toward the $60,000 demand zone.
Wrapping it Up
Bitcoin is showing early signs of short-term stabilization, supported by a rebound in momentum, but the broader structure remains cautious. As long as the BTC price trades below the descending trend line, upside moves are likely to be corrective rather than trend-changing. A confirmed breakout and acceptance above the 0.5 Fibonacci level would be needed to shift sentiment and invite stronger buying interest toward higher levels.
Until that happens, the market stays range-to-weak, with traders watching closely for either a breakout confirmation or another rejection-driven move lower.


 English (US)