 3 months ago

The post Bitcoin Price Bottom Near? On-Chain Signals Suggest a Macro Turning Point appeared first on Coinpedia Fintech News
The broader crypto market remains under pressure today, and Bitcoin continues hovering near the $66,000 region after a sharp correction phase. Momentum appears fragile, sentiment is defensive, and headlines still revolve around the recent bitcoin price crash. Yet beneath the surface, structural data tells a more measured story.
Several on-chain indicators are approaching zones historically associated with macro exhaustion rather than fresh breakdown cycles. Liquidity is contracting, accumulation behavior is shifting, and risk-adjusted return metrics are nearing levels that have previously marked Bitcoin price bottom formations. This does not confirm a reversal. But it does suggest that the market may be entering a bottom zone rather than accelerating into a new bear leg.
Here’s what the on-chain data shows.
Liquidity Contraction Mirrors Prior Bottom Phases
Stablecoin liquidity, the lifeblood of crypto markets, is tightening rapidly. Over the past 60 days, USDT market capitalization has declined by more than $3 billion, pushing the 60-day market cap change toward levels last observed during the 2022 capitulation event. Historically, sharp stablecoin contractions reflect capital exiting the system during fear-driven phases. However, past cycles reveal an important pattern: When liquidity contraction reaches extreme negative readings and begins stabilizing, Bitcoin price bottom formations often follow.
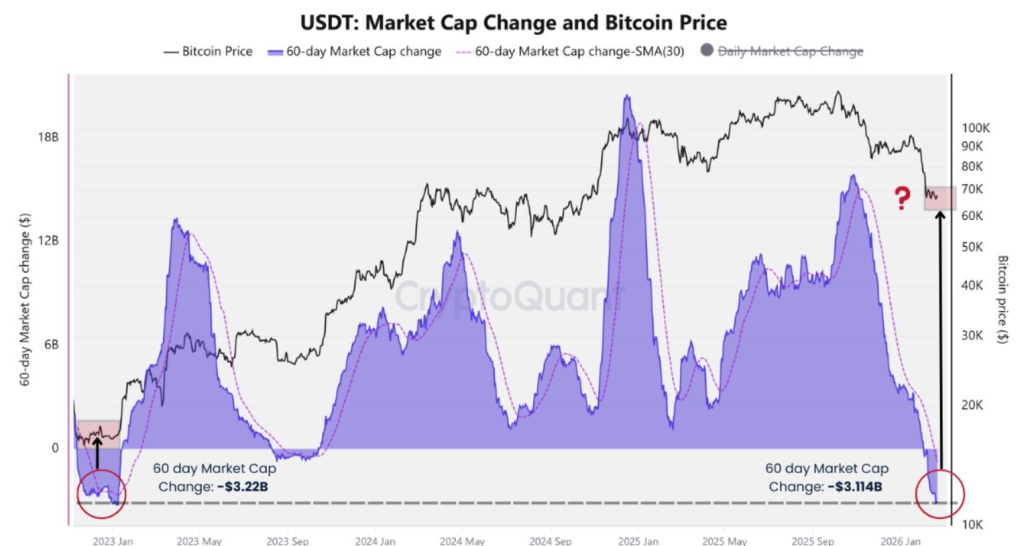
Similar liquidity compression occurred during:
- The 2015 bear market low
- The 2019 mid-cycle reset
- The 2022 post-FTX capitulation
Liquidity drives directional momentum. When contraction slows and inflows stabilize, price typically reacts before sentiment improves. At present, the market appears closer to exhaustion than expansion.
Smart Money Vs. Retail: Early Bottom Formation Beneath the Surface
While the recent bitcoin price crash has dominated headlines, supply-side behavior tells a more layered story. Accumulation addresses, wallets that historically receive BTC without meaningful distribution continue to expand.
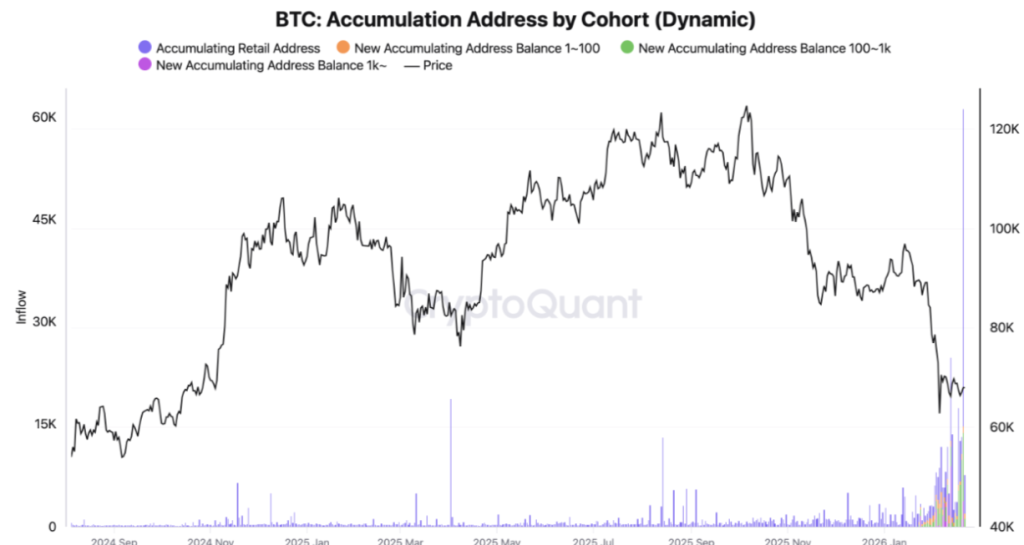
Data shows sub-1 BTC holders steadily increasing their share of circulating supply, while the 30-day moving average of inflows into long-term holding wallets remains elevated. This suggests smaller participants are gradually absorbing supply near the $65K region rather than capitulating.
At the same time, whale dynamics are shifting, though not aggressively bullish yet. The 10–10,000 BTC cohort has reduced distribution intensity compared to prior weeks. Large holders are no longer unloading at the same pace, signaling that active sell pressure may be cooling. Major Bitcoin price bottom formations historically develop in stages. First, distribution slows. Then absorption increases. Finally, aggressive accumulation begins once volatility compresses.
Bitcoin’s current behavior resembles early-stage base construction rather than full-scale reversal. Retail appears to be positioning gradually, while whales have moved from active selling toward neutrality. That transition is often the first structural step toward stabilization.
Bitcoin’s Sharpe Ratio Enters Historical Bottom Zone
One of the most compelling signals comes from Bitcoin’s Sharpe Ratio. The Sharpe Ratio measures risk-adjusted return, essentially how much return investors earn relative to volatility. When it drops deeply negative, it reflects poor short-term performance compared to risk taken.
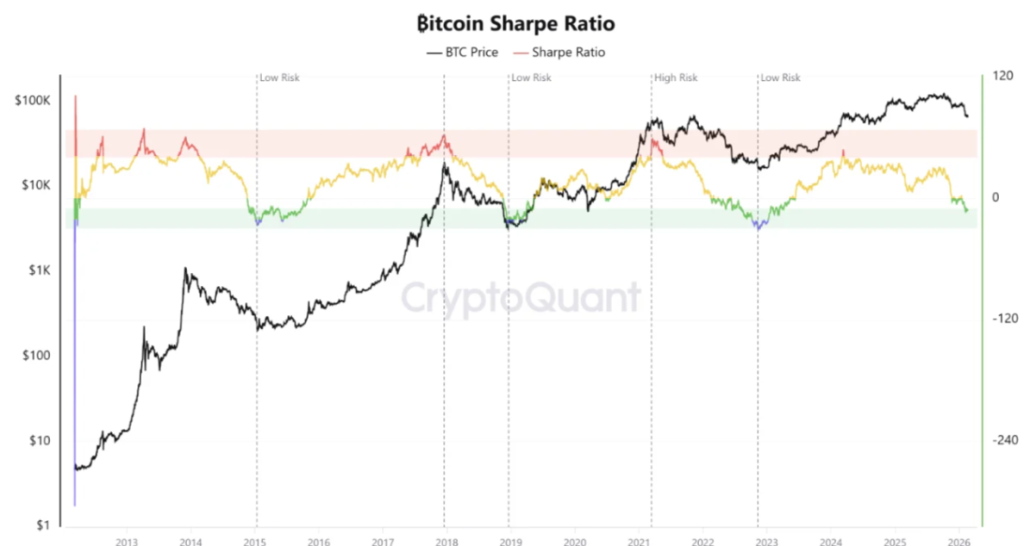
Historically, these negative extremes have aligned closely with:
- The 2015 macro bottom
- The 2019 reset
- The 2022 capitulation zone
Current readings are approaching the lower historical band often associated with low-risk accumulation phases. The Sharpe Ratio does not call the exact bottom. It identifies when the risk-reward profile shifts favorably for long-term positioning. Right now, that shift is approaching historically significant territory.
Final Words
The Bitcoin price bottom is not confirmed, but structural signals suggest the market is approaching exhaustion. Liquidity contraction is nearing historical extremes, accumulation activity is rising, and distribution pressure is cooling. If macro conditions stabilize and support near the mid-$60K region holds, the current phase may evolve into base formation rather than deeper breakdown.


 English (US)