 3 months ago
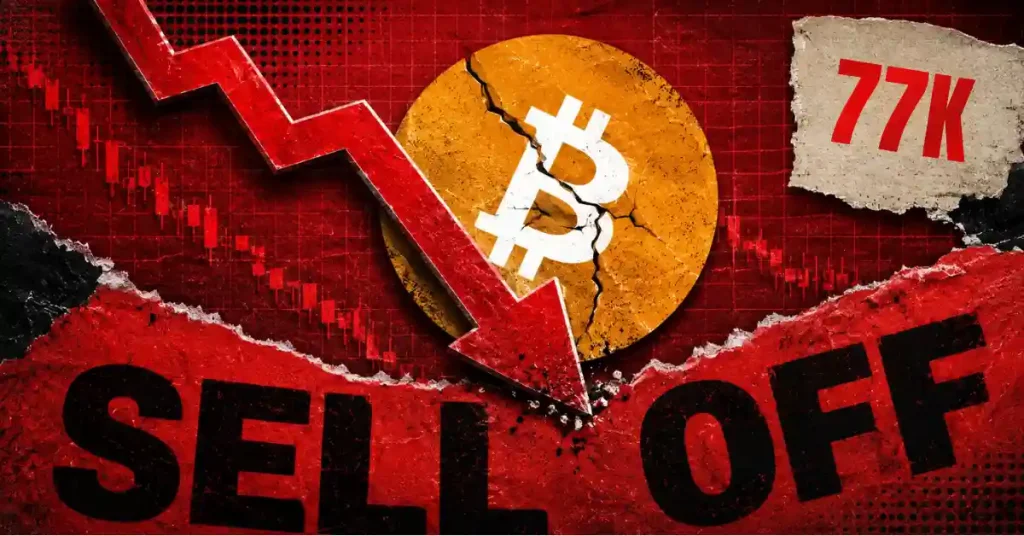
The post Bitcoin Price Hits $71K While Stocks and Silver Fall: Is the Crypto Bear Market Over? appeared first on Coinpedia Fintech News
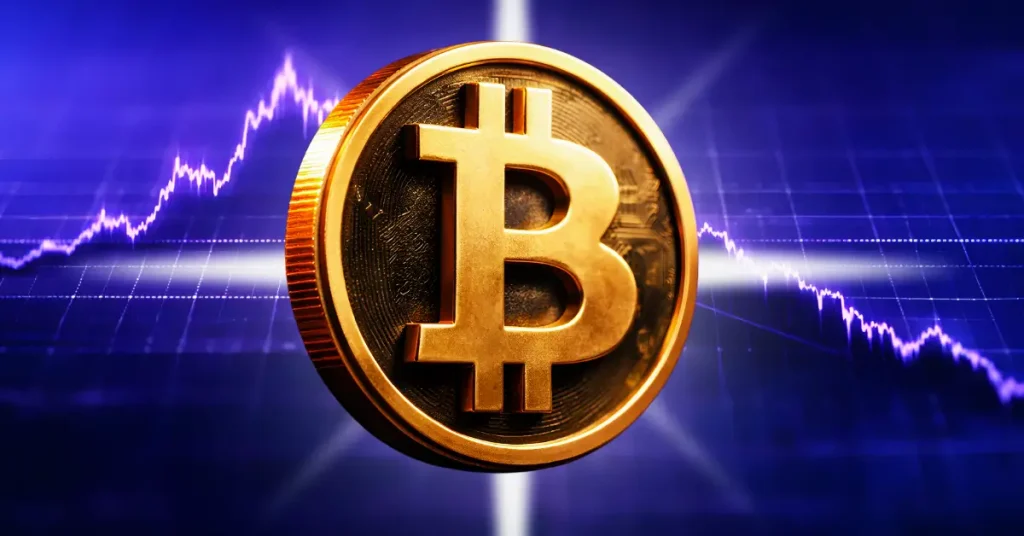
Stocks are falling. Silver is sliding. Oil is climbing on war fears. And Bitcoin just hit $71,490. That’s not how risk assets are supposed to behave. But here we are.
Since the US and Israel launched strikes on Iran, Bitcoin dropped near $63,000. It has since recovered close to 10%. While Asian equities sold off and oil prices pushed higher on supply route fears, Bitcoin seems to be going the other direction.
Van de Poppe Has a Theory
Analyst Michaël van de Poppe posted what might be the most-watched crypto call this week:
“Constantly higher lows are made on the markets, therefore upside on Bitcoin. The upside on commodities is done. The bear phase for Bitcoin is also done. Good times are ahead.”
That’s a big statement after five straight months of losses, which is the worst streak Bitcoin has seen since the 2018 bear market.
Why Is Bitcoin Going Up?
Market maker Enflux told CoinDesk: “The market is pricing in neither a catastrophe nor a solution. As the escalation did not immediately lead to a broader regional war, short-covering began.”
In other words, bearish traders closed their positions when the worst-case scenario didn’t materialize.
Bitcoin spot ETFs had shed $8.9 billion during the correction – the largest drawdown since their launch. In the past five trading days, $1.45 billion has come back. BlackRock’s IBIT, which led the selloff, is now leading the recovery with $882 million in weekly inflows.
Read More: Bitcoin ETF Flows Flip Green After Record $8.9B Drawdown: Why Is the Money Coming Back?
Bloomberg’s ETF analyst Eric Balchunas called it: “Breadth and depth. This after a 50% drawdown and most underwater. Even I’m impressed.”
CryptoQuant’s data adds another layer: exchange deposit volumes are low, which signals that sell-side pressure is exhausting itself.
Key Levels to Watch
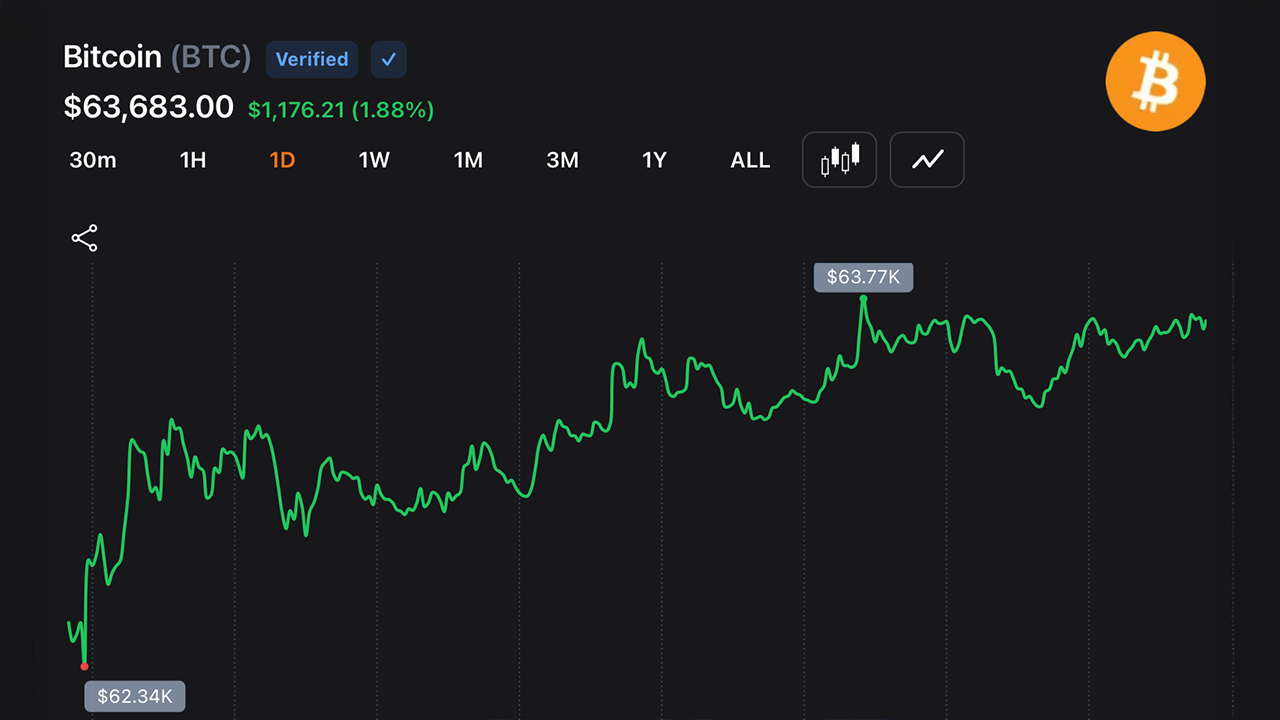
Bitcoin is pushing toward the $74,373-$76,341 zone, where the EMA50 and SMA50 converge on the daily chart. This band has rejected price repeatedly since October 2025.
If it breaks above it, analysts see a path to $90,000. If it fails here, a return below $60,000 remains on the table.
The RSI has climbed to 54, just above neutral. The overall technical picture now reads Buy. But the SMA50 at $76,341 still signals Sell.
This recovery is gaining structure and hasn’t cleared the wall yet.
Altcoins Are Moving Too
Ethereum is up 6.77% on the day, Solana 7.88%, XRP 5.26%. The altcoin season index reads 32 out of 100 – deep in Bitcoin Season territory.
Polymarket gives a 74% probability that Bitcoin reaches $75,000 this month, which is the exact resistance zone the technicals are pointing to.
Whether this is the start of something or just another relief rally before pain, the next two weeks on Bitcoin’s chart will have the answer.


 English (US)