 2 months ago

The post Ethereum Price Prediction: Can ETH Price Defend the $3000 Support Zone as Whale Activity Intensifies? appeared first on Coinpedia Fintech News
The Ethereum price has slipped more than 4.5% over the past 24 hours, pulling the price back below the $3,000 mark and hovering near $2,962. Adding to the pressure, ETH ETFs recorded notable outflows, with similar weakness seen across BTC and XRP products, signaling a risk reset rather than a clean “risk-on” push. At the same time, whale activity has picked up, a signal traders often read as smart-money positioning ahead of volatility. That sets up a key turning point: can ETH reclaim $3,200 and restore bullish momentum, or will another rejection invite a deeper correction?
Dormant ETH “OG” Whale Reactivates—Is Smart Money Positioning Early?
Here, the ETH price is consolidating within a very narrow range, indicating that it is in a strong accumulation phase. In times when retail appears to be skeptical about the next price action, the whales seem to have intensified their activities. The data from Lookonchain suggests that an OTC whale is sourcing size through institutional routes, with repeated 10,000 ETH clips routed via FalconX and Wintermute.
These tokens are further cycled into staked ETH via Lido-linked flows, which largely resemble a strategic accumulation, not panic selling. Secondly, yet another data point shows that an Ethereum OG wallet has just moved more than 14,000 ETH to a Coinbase deposit address. Put together, the takeaway of these charts suggests the whales are active and decisive. One cohort appears to be buying, while an older holder is bringing supply back to the market via Coinbase.
What’s Next—Will the OTC Bids Absorb Spot Supply or Thin Out?
In a falling market like now, this combination usually precedes a higher volatility phase. Considering the current scenario, if the OTC bids absorb the spot supply, the ETH price can stabalise and attempt a rebound. Besides, if exchange deposits accelerate and bids thin out, the token is likely to dig deeper. Technically, the Ethereum price has entered a crucial yet decisive phase where a failure may attract over 20% loss.
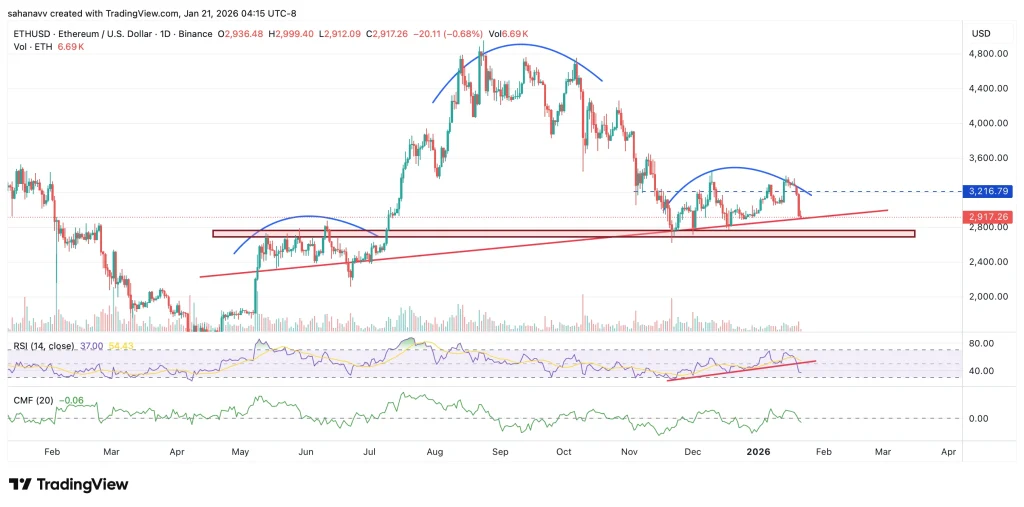
As seen in the above chart, the ETH price is testing the neckline of the head and shoulder pattern and is failing to defend it. The market dynamics and the chart patterns have turned bearish, hinting towards an extended descending trend. The RSI has broken down from a rising pattern, while the CMF has also plunged below 0. These indicators combined suggest a higher probability of a continued descending consolidation or another steep leg lower. This may continue until the RSI recovers to 50 and the CMF flips back above 0.
The Bottom Line
Ethereum is still trading in a pressure zone, where whale flows look constructive on the surface, but momentum and money flow haven’t confirmed a bottom yet. The OTC activity suggests dip demand is real, but the OG Coinbase deposit keeps a lid on sentiment because it increases the risk of near-term supply hitting the market. With RSI near the mid-30s and CMF slightly negative, ETH needs a decisive reclaim to prove buyers have control.
If buyers defend the $2,900–$2,850 area and ETH price reclaims $3,000, the next upside checkpoints sit at $3,080–$3,120, followed by the key breakout wall at $3,200. A clean close above $3,200 opens room toward $3,350–$3,450. However, if Ethereum fails to regain $3,000 and loses $2,850 on a daily close, downside targets shift to $2,750, then $2,620–$2,550 as a deeper correction plays out.


 English (US)