 1 month ago

The post Ethereum Price Recovery Stalls as On-Chain Data Turn Bearish: Sell-Side Pressure Building? appeared first on Coinpedia Fintech News
Ethereum price slipped back below the $2,000 mark as the crypto market turned defensive, with major assets easing after failing to sustain their recent recovery attempts. The drop unfolded gradually rather than through panic selling bids kept thinning across the session until $2,000 support finally gave way, pushing ETH price down close to 5% intraday.
Beneath the surface, the weakness had already been forming. Spot demand stalled near resistance, large holders began shifting coins toward exchanges, and derivatives positioning slowly tilted bearish. By the time Ethereum price broke support, the move reflected positioning more than surprise, the market had already prepared for it.
Large Holder Deposit Raises Sell-Side Liquidity
On-chain data shows Garrett Jin moved roughly 261,024 ETH ($545M) to Binance, a type of transfer traders typically monitor because exchange deposits increase available supply. Such flows do not always mean immediate selling, but they frequently precede hedging or distribution. The timing is notable, the transfer appeared as ETH struggled to hold the $2,100–$2,200 region, and shortly after, bids weakened across spot markets.
 BREAKING:
OG WHALE, GARRETT JIN, DUMPING HIS CRYPTO AHEAD OF TRUMP’S SPEECH TODAY
HE JUST DUMPED $350 MILLION WORTH OF $BTC AND $545 MILLION WORTH OF $ETH
WHAT IS GOING ON?? https://t.co/gvDAdDroAT pic.twitter.com/LuCaraXqLk
 (@ardizor) February 15, 2026
Following the deposit, ETH price didn’t drop sharply, yet upside follow-through disappeared and each recovery attempt stalled-near $2100. This is typical distribution behaviour, price weakens from anticipation, not execution.
On-Chain Metrics Show Cooling Demand and Active Selling
On-chain metrics activity also reflects a slowdown in conviction rather than panic. Binance data shows daily volume near 486K ETH, while the 30-day volume Z-score sits around −0.39. Negative readings indicate trading activity is below its monthly average.
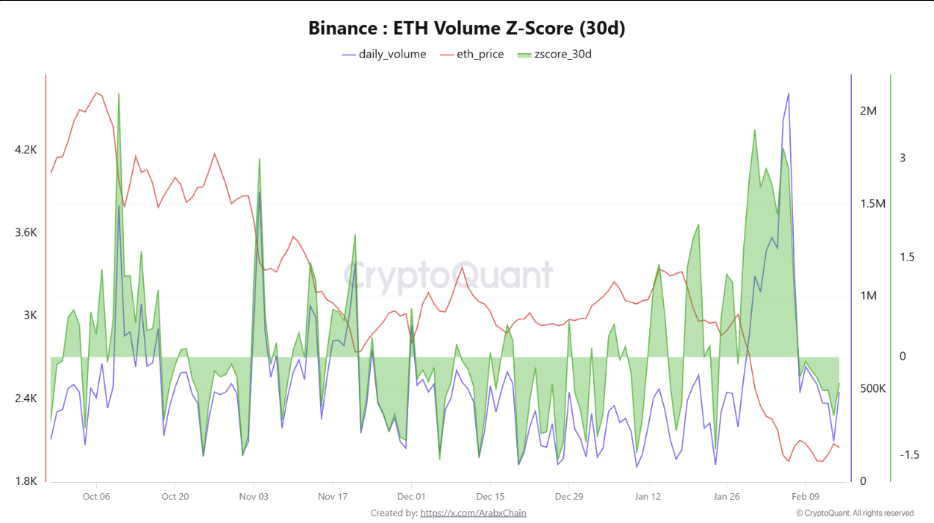
Historically, this condition appears during consolidation or redistribution phases rather than trend expansion. In practical terms, fewer aggressive buyers are stepping in to defend support levels. Instead of capitulation, ETH is drifting lower as participation fades often a precursor to larger directional moves once liquidity concentrates.
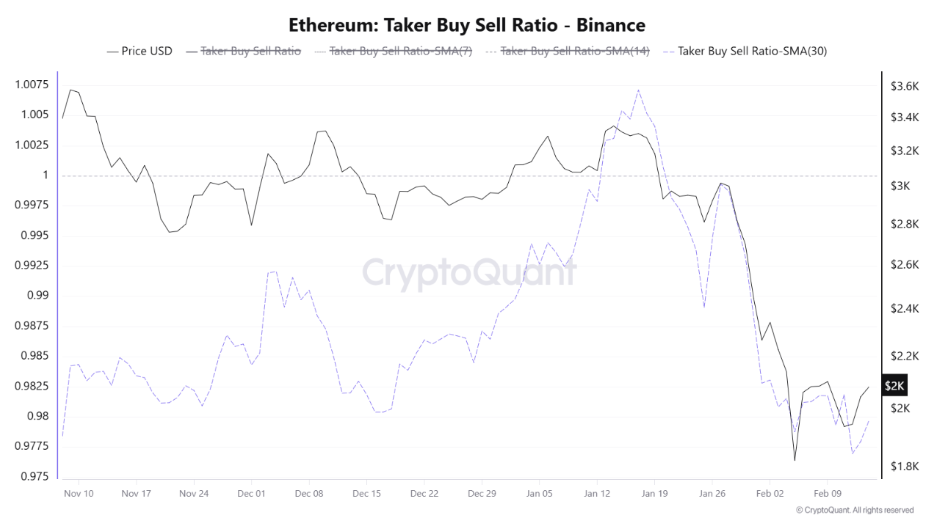
The taker buy/sell ratio has dropped to 0.97, its lowest level in months. Values below 1.0 mean market sell orders dominate market buys, showing sellers are actively hitting bids rather than passively waiting. This matters because derivatives traders typically lead short-term momentum. Readings below equilibrium usually accompany hedging or short positioning, which suppresses upside attempts and increases volatility during breakdowns.
Ethereum Price Structure Shows Post-Breakdown Consolidation: What’s Next?
Ethereum price structure showcasing sideways movement in the past few sessions. After losing its prior range support zone of $2500, ETH price did not accelerate downward, instead it transitioned into a tight sideways band below the $2,000 mark. The previous support area around $2,020–$2,080 has clearly flipped into supply. Each recovery attempt pushes into that zone and stalls quickly, showing trapped longs are exiting while short-term traders fade strength. Acceptance below a reclaimed level matters more than the break itself, and ETH has now spent several sessions trading underneath it confirming the market recognizes lower value.
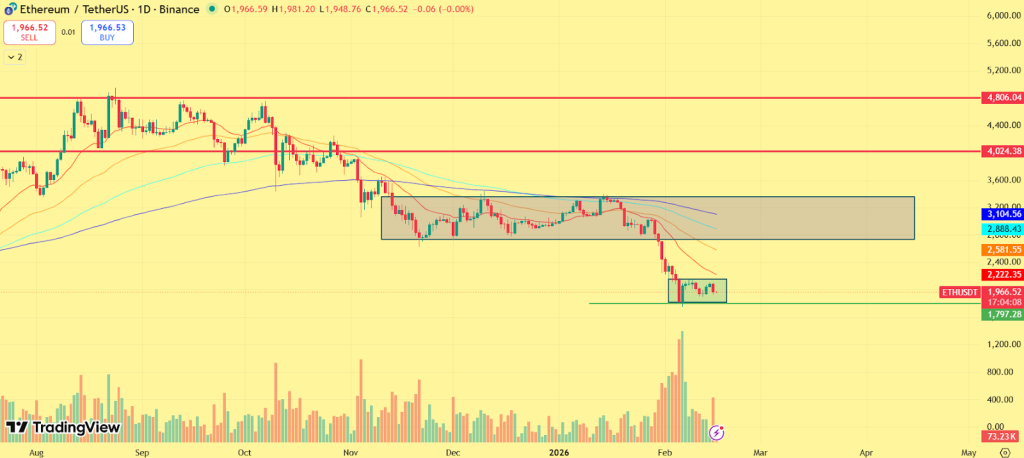
ETH’s short-term moving averages are compressing above price and acting as dynamic resistance, keeping rebounds shallow. Meanwhile, volatility has contracted, signaling equilibrium formation rather than trend continuation. As long as ETH price remains capped under the former range, the structure favors continuation pressure. A decisive close back above $2,080 would invalidate the breakdown and shift momentum neutral-to-bullish. On the other hand, a break below the $1800 support mark may push ETH toward $1500 in the next sessions.


 English (US)